Background
Most dashboards don’t fail because of bad analysis; they fail because they’re presented poorly. I’ve seen presentations where every chart was explained in detail, and the audience still walked away without a clear takeaway.
I took Andy Kriebel’s Makeover Monday challenge a step further by thinking about something I don’t see discussed often: how to actually present a dashboard. Especially when it’s a one-page overview, the challenge isn’t building it—it’s walking someone through it in a way that lands.
In most real-world settings, you’ll have about 15–20 minutes. That’s just enough time to communicate the story without overwhelming your audience—if you’re intentional about how you structure it.
This is a structure I’ve used when presenting dashboards in real-world settings (team reviews, stakeholder check-ins, and decision-focused meetings) where time is limited.
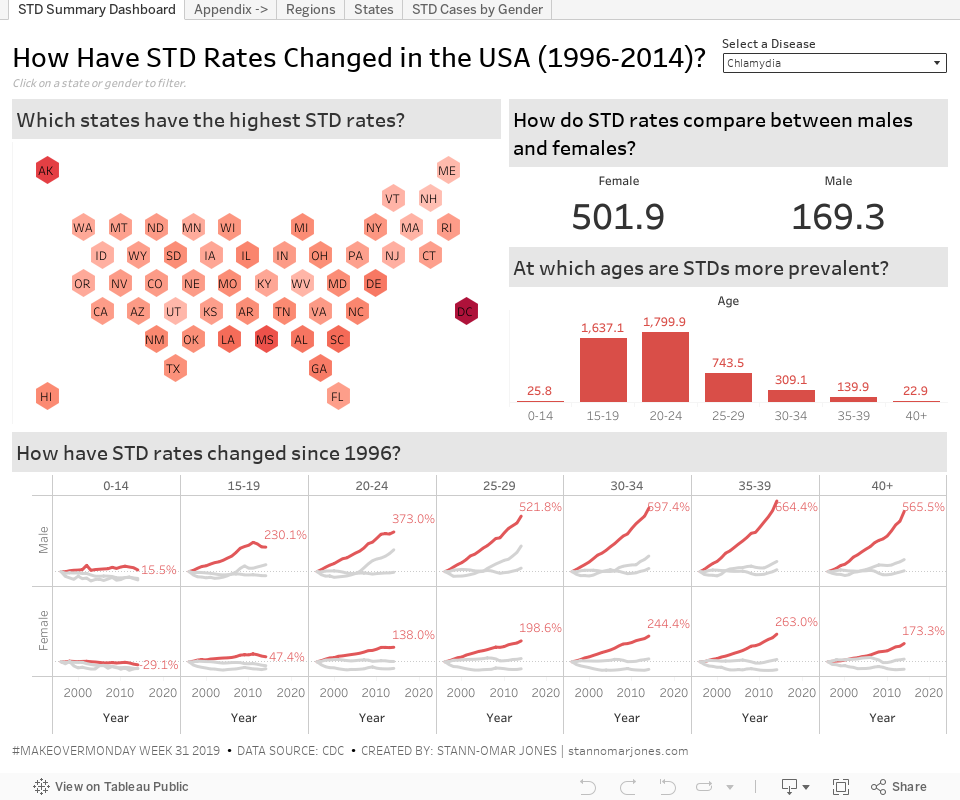
Here’s the example dashboard referenced throughout this walkthrough. As you read, you can refer back to it to see how each step maps to a real presentation.
1. Start with Context (4–5 minutes)
Before touching the dashboard, set the stage.
- What is the goal? What decision is this dashboard meant to support?
- Who is this for? Analysts? Executives? Operators?
- What should they pay attention to?
Keep this tight. You’re not explaining everything—just orienting the audience so the visuals make sense.
Example: “This dashboard looks at how [X metric] has evolved over time to help [audience] make decisions about [Y].”
2. Show the Flow (1–2 minutes)
Don’t assume the layout is obvious.
Walk through the dashboard in a logical order (usually top-left → bottom-right), and explain how sections connect.
- What does each section represent?
- How should the audience move through it?
- How do different views relate?
👉 Tip: click or interact with the dashboard as you explain. It helps people follow along and makes the presentation more engaging.
3. Highlight Key Insights (5–7 minutes)
This is the core of your presentation.
Focus on 3–5 insights max. In practice, this usually means prioritizing the handful of metrics that directly impact decisions e.g. conversion rates, retention, pipeline movement, or whatever your team is actually optimizing for. More than that, and people will forget everything.
For each insight:
- State the finding clearly
- Point to the visual
- Briefly explain why it matters
Example: “We’re seeing a 10% drop in conversion rate this quarter, despite increased traffic. This suggests an issue with user experience rather than acquisition.”
Avoid narrating every chart. Your job is to interpret, not describe.
4. Make It Actionable (2–3 minutes)
Insights are only useful if they lead somewhere.
- What should the audience do next?
- What decisions does this support?
- What should be investigated further?
Example: “Given this trend, we should prioritize [X] and explore [Y] in more detail.”
Even if you don’t have definitive answers, point toward next steps. In many cases, this means translating metrics into concrete actions like prioritizing a product fix, reallocating budget, or adjusting targeting strategy.
5. Q&A and Discussion (3–5 minutes)
This is where strong presentations stand out.
Be ready for:
- questions about assumptions (e.g., how a metric is defined, what’s included in a cohort, or how data was filtered)
- requests to drill deeper
- challenges to your interpretation
A few things that help:
Separate facts from hypotheses
“We observe X. One possible explanation is Y.”
Use cautious language Avoid overclaiming unless you have strong evidence.
Acknowledge gaps It’s fine to say what the dashboard does not answer.
Reference external context when relevant Research, benchmarks, or domain knowledge can strengthen your points.
Common Pitfall
The most common mistake is trying to explain everything.
You don’t need to walk through every metric or every chart. In fact, doing so usually weakens your message.
Your goal is simple: 👉 help the audience understand what matters and what to do next.
In Summary
A strong dashboard presentation isn’t about showing everything—it’s about guiding attention.
- Start with context
- Show the flow
- Focus on a few key insights
- Make them actionable
- Be ready for discussion
Done well, a 20-minute walkthrough is more than enough to turn a dashboard into a decision-making tool.